Rate Aggregators
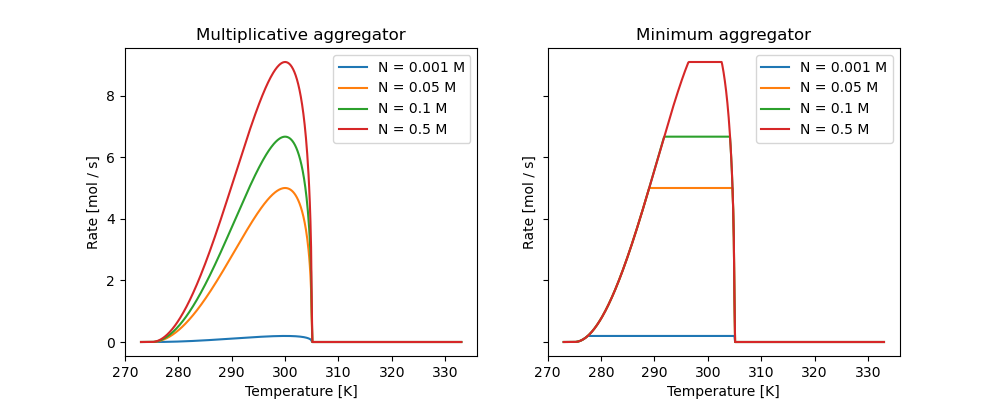
NutMEG calculates microbial metabolic rates and growth rates by aggregating ForcingFactors and a BaseRateModel. One common aggregator is the multilicative model:
\[r = r_{max} \prod^i F_i\]
where \(F_i\) are the forcing factors. Another common aggregator is Leibig’s law of the minimum:
\[r = r_{max} \min( F_1, F_2, ... F_i)\]
The snippet below creates two forcing factors with a constant maximum base rete, then shows how these two aggregators can contribute to the metabolic rate of a BaseOrganism object:
the four temperature-dependent BaseRateModels which have the same value at 298 K.
import NutMEG as nm
import NutMEG.core as nmc
import NutMEG.models as nmm

import numpy as np
import matplotlib.pyplot as plt

R = nmc.Reactor()
nmc.Reagent('N', R, amount=(0.001, 'molal'), thermo=False)

# assign a constant max rate.
c = nmm.base_rate_models.ConstantRate(10.)

# Make two forcing factors, one for T, one for N concentration:
BP = nmm.forcing_factors.BiologicalPerformance('T', 300, 275, 305, 2.)
M = nmm.forcing_factors.Monod('N', 0.05)

Agg = nmm.aggregators.Multiplicative()
Agg1 = nmm.aggregators.LeibigMinimum()

# initialise a BaseOrganism with these forcing factors
org = nmc.BaseOrganism(
  'organism',
  nmc.org.Metaboliser(None, base_rate=c, forcing_factors={'BioPerf':BP, 'Monod':M}))

fig, axs = plt.subplots(ncols=2, figsize=(10,4), sharey=True)

Ns = [0.001, 0.05, 0.1, 0.5] # N concentrations
Ts = np.linspace(273, 333, num=500) # temperature range

for i, A in enumerate([Agg, Agg1]):
    # Assign the organism's metabolic aggregator
    org.metabolism.aggregator = A
    for N in Ns:
        R.composition['N'].update_amount(R, mol=N) # set the N concentration
        rates = []
        for T in Ts:
            R.T = T # set the locale temperature
            # calculate the rate. this applies the aggregator.
            rates.append(org.metabolism.compute_rate(org, R))
        axs[i].plot(Ts, rates, label=f'N = {N} M')
Which results in the below plot:
Note
Can’t decide on an aggregator? No problem! It is possible to mix and match by being creative with your ForcingFactors.